Basic Charts
EXM provides support for nine different platform reports that are accessible. Users are provided with instant access to these nine reports for them to view and interact with their data. Surprisingly close to Microsoft Excel in both their appearance and their operation, the reports have a remarkably familiar feel to them.
These reports are intended to address the immediacy of a certain component of the data that is not unduly complex but does call for some action to be taken to address it.
Even though these are the basic reports, there are capabilities to alter these reports using experienced resources that can design or edit a report to satisfy any business requirement.

View the chart
Since the chart has been constructed at this point, the model-driven app will be able to make use of it to show table data. To view the chart, please follow these steps:
Open a model-driven app that contains your table via a solution or open the app directly from the Apps area.
Select ... next to the app, and then select Play. The model-driven app opens in a separate browser tab.
On the left navigation pane, select a table such as Alert.
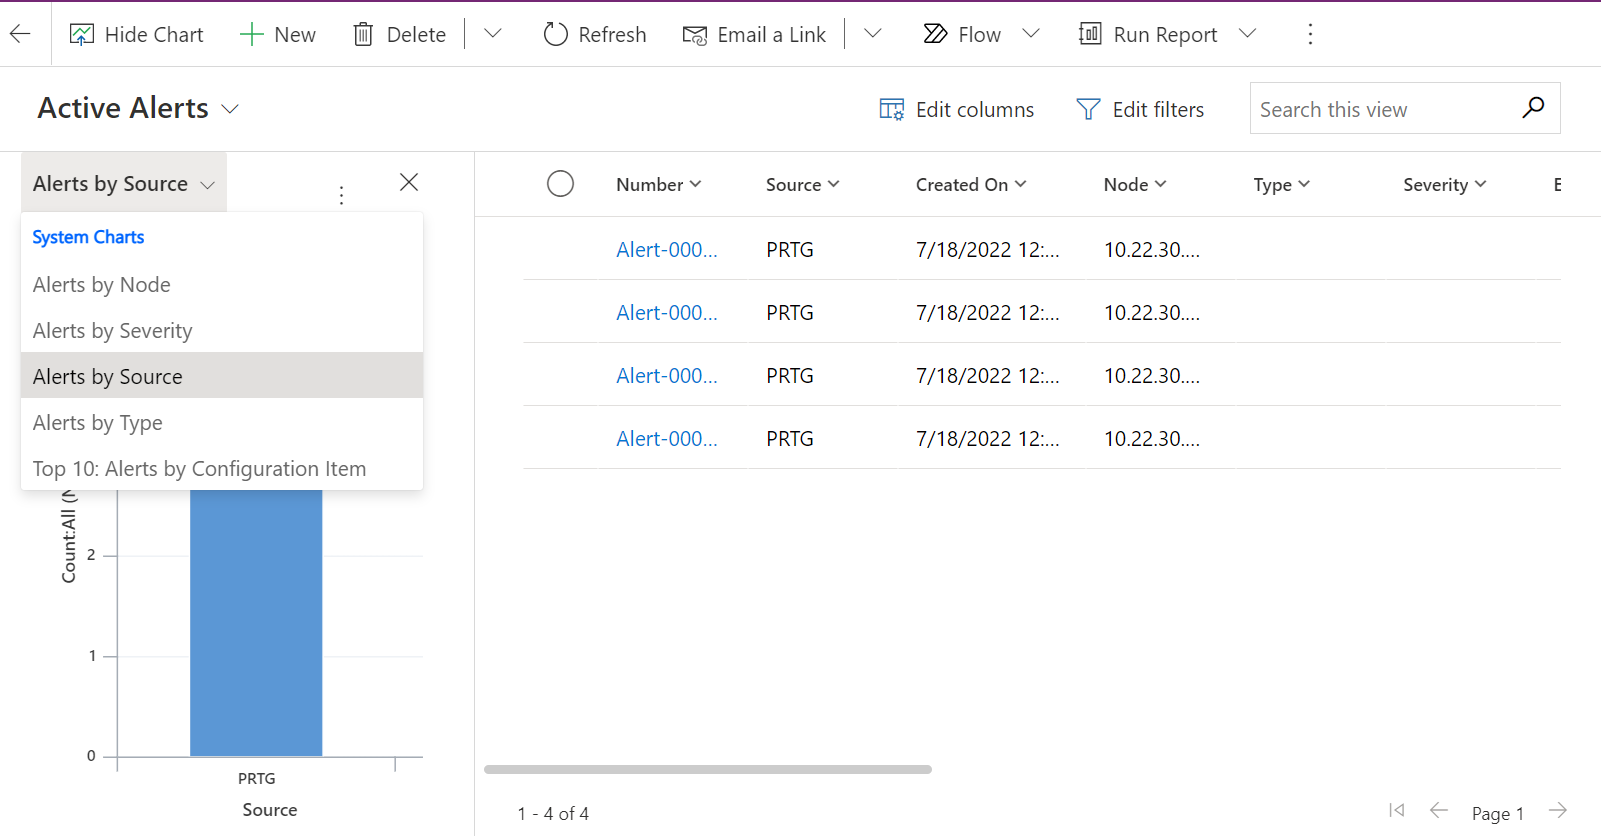
On the command bar, select Show Chart.
The chart pane opens.
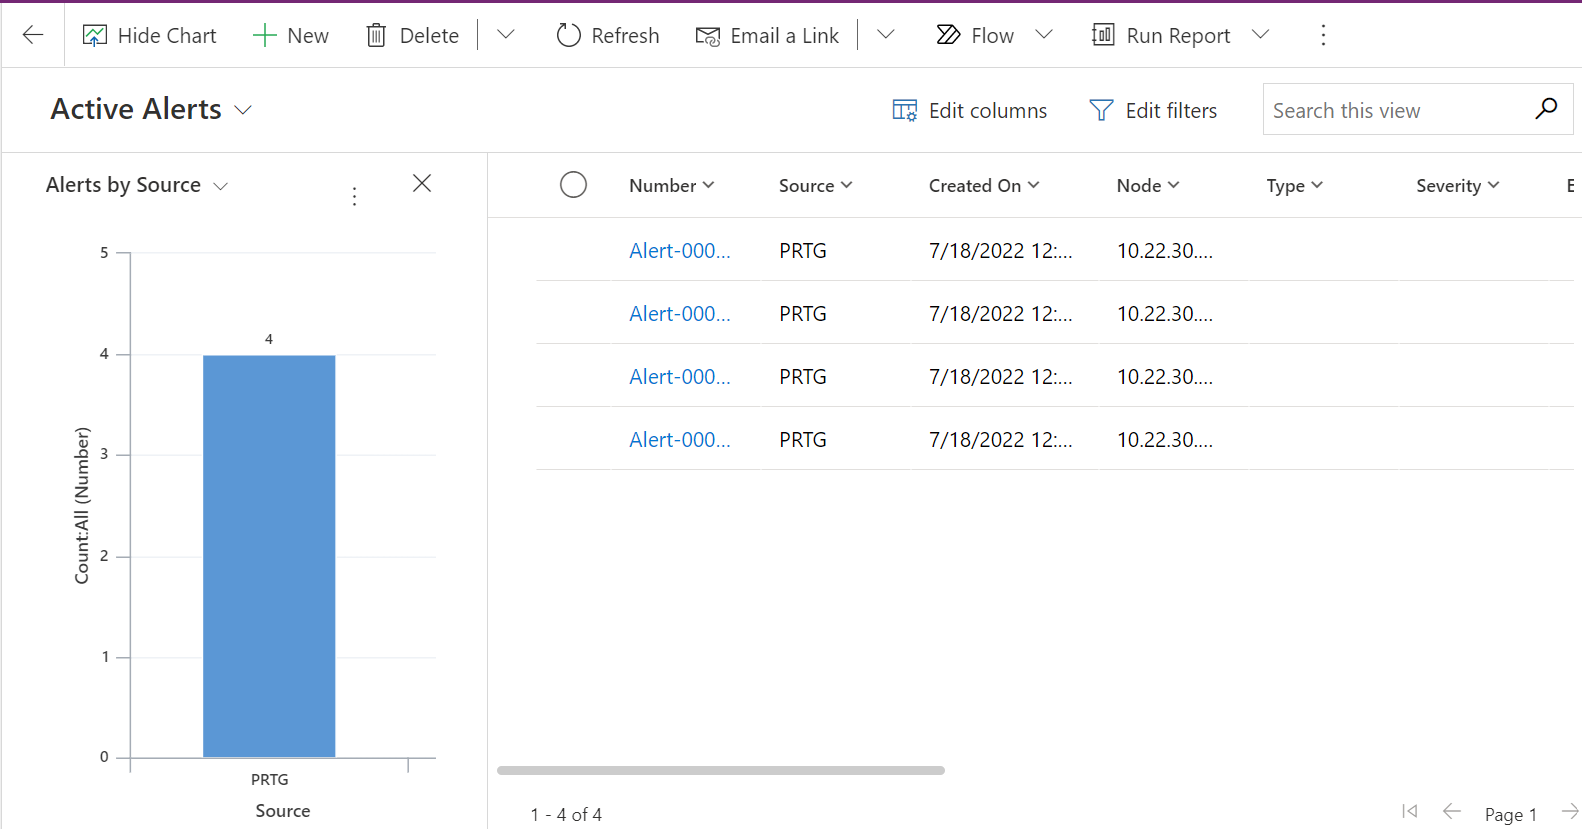
By selecting the dropdown chart list, any of the system charts in the app will be available to select.
The chart appears in-line with the data view.