Basic Charts
EXM has support for out of platform reports (OOP). These reports are at once available to users to view and interact with their data. The reports are remarkable like MS-Excel with respect to the look and feel.
These reports are designed to address the immediacy of a particular aspect of data that is not overly complex but requires some action to address.
While these are the OOP reports, there are capabilities to change these reports using trained resources that can tailor a report to meet any business requirement.
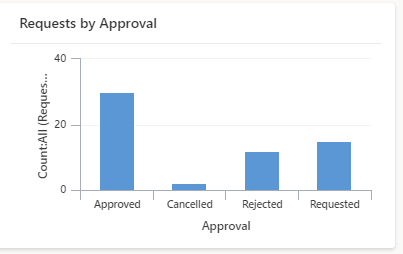
View a chart!
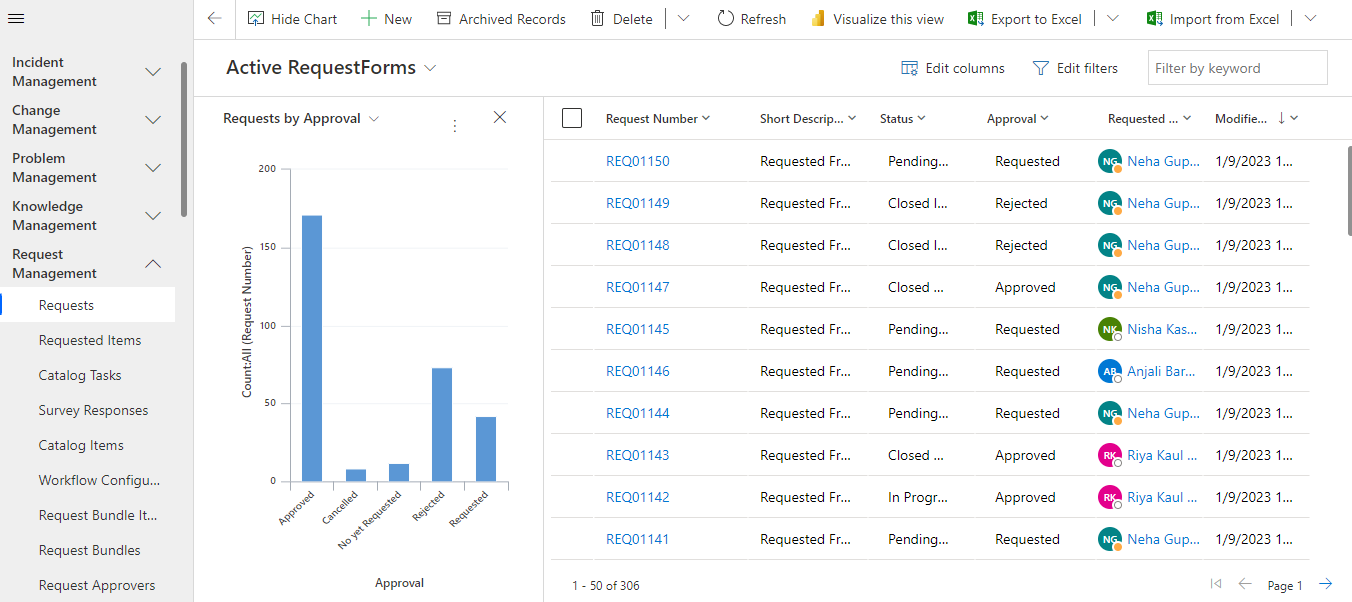
Congratulations on creating your chart! Now, it's time to utilize it to graphically represent your table data within your model-driven application. To view your newly created chart, please proceed with the following steps:
Access a model-driven application that houses your table data. This can be done either through a dedicated solution or by directly launching the app from the Apps area.
Next to the application, click on the three dots (…) for more options, then select "Play". Your model-driven application will open in a separate browser tab.
In the application's left navigation pane, select a table, such as "Accounts", that you wish to work with.
Now, locate the command bar at the top of your screen and click on "Show Chart".
Voila! Your chart pane will open, showcasing your data in an easy-to-understand visual format.
Dashboards
A dashboard is a collection of reports whether labelled as “Easy” or “Advance” into a logical grouping that supplies business or technical information to specific users.
After any report type is created it may now be associated to the webpage for viewing. As best practice a strategic and insightful dashboard has between 4 to 6 reports. These reports supply a very targeted view of the data being collected and seen. Thus, aiding a company to make informed decisions whether from a business or technical perspective to keep guidance on a company’s ITIL journey.
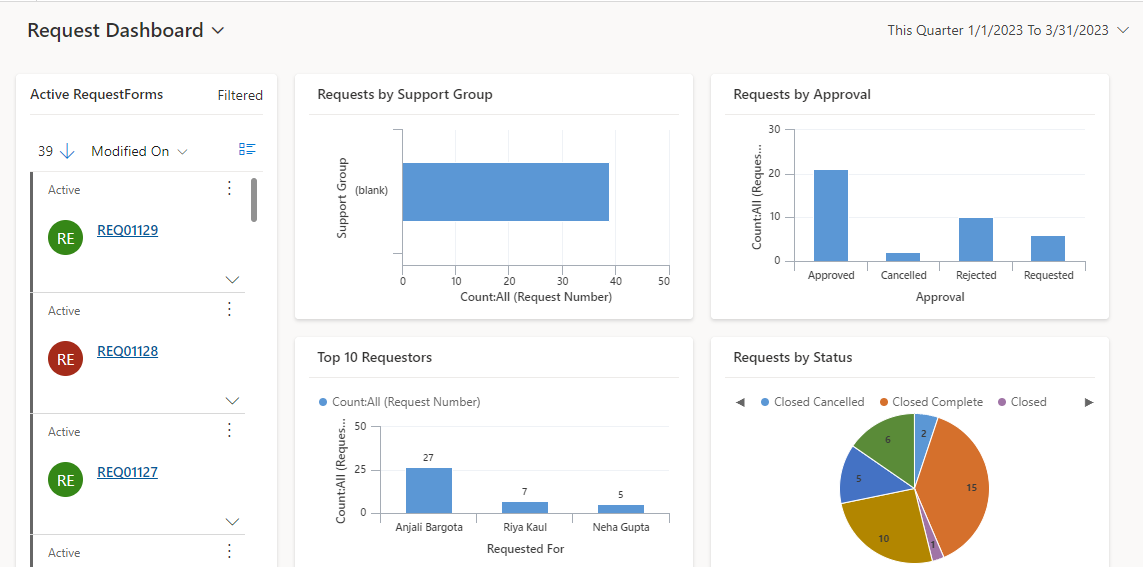
Request Dashboard
If you're looking to access the Request Dashboard in the application, follow these steps:
From your application's main page or home screen, locate the navigation menu, usually found on the left-top of your screen.
Browse through the options in the navigation menu and look for the "Request Dashboard" option.
Click on the "Request Dashboard" option. This should redirect you to the dashboard where you can view, manage, and analyze your requests.
Remember, the Request Dashboard is a powerful tool for managing and tracking requests. You can view their status, assign them to team members, prioritize them.
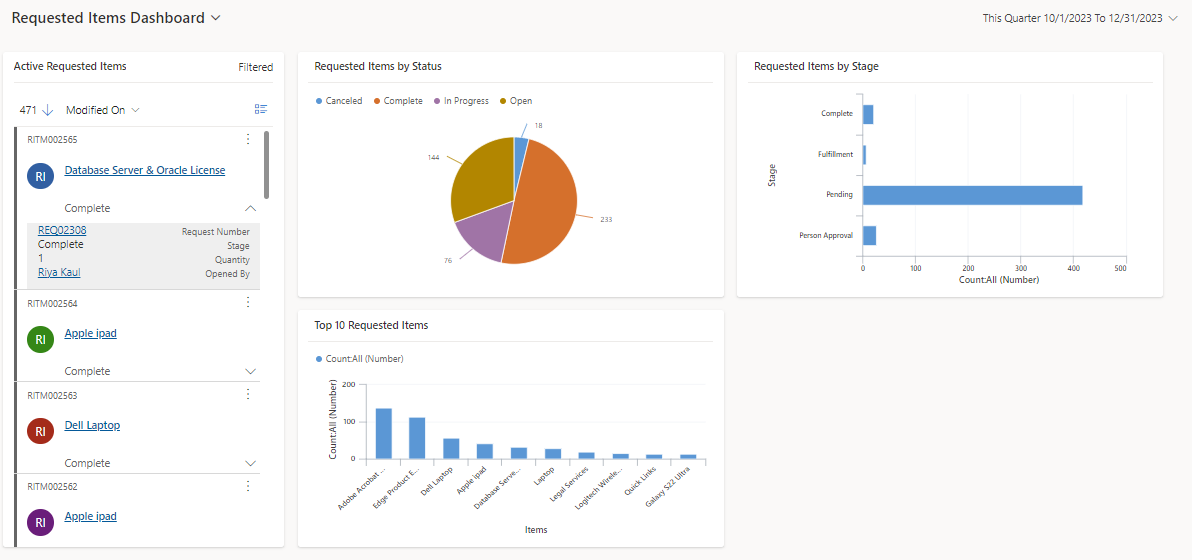
Requested Item Dashboard
Accessing the Requested Item Dashboard is a straightforward process. This dashboard provides a comprehensive view of all your requested items, making it an essential tool for tracking and managing your requests. Here's how you can access it:
Start from your application's main page or home screen. A navigation menu is placed on the left-top of your screen.
Scan through the options available in the navigation menu. You're looking for "Requested Item Dashboard".
Once you locate "Requested Item Dashboard", click on it. This will take you to the dashboard where you can oversee all your requested items.
The Requested Item Dashboard serves as a hub for you to track the status, assignees, priority levels, and other relevant details of your requested items.
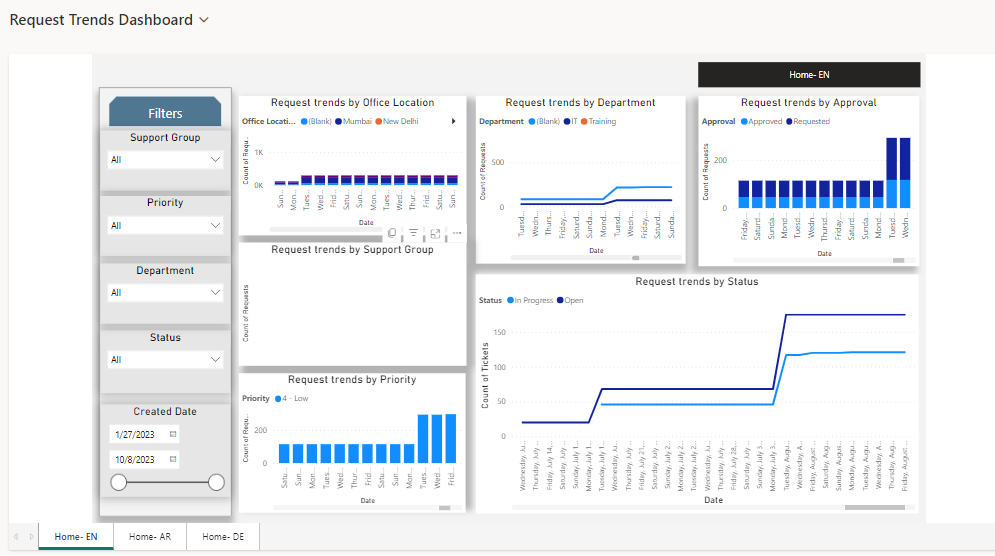
Request Trends Dashboard
If you're looking to navigate to the Request Trends Dashboard, please follow the steps below. This dashboard offers a valuable overview of trends in your requests, allowing for strategic planning and efficient resource allocation.
Begin from the main page or home screen. The navigation menu, is located on the top-left side of your screen.
Search through the options in this navigation menu for "Request Trends Dashboard".
Upon finding the "Request Trends Dashboard", click on it. You will then be redirected to the dashboard where you can observe and analyze trends related to your requests.
The Request Trends Dashboard is a powerful analytic tool for understanding patterns and trends in your requests over a period of time.